Plot of the Calculation Results
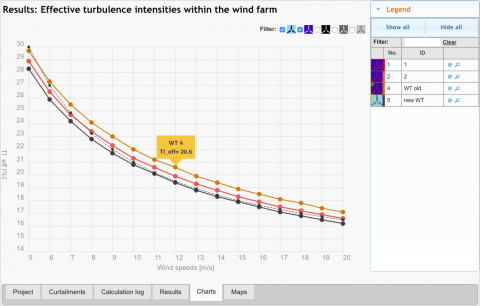
The new "charts view" shows the calculation results as a plot of the effective turbulence intensities depending on the wind speed. The display may be reduced to a group of WTs or single WTs. Additionally the design values will be shown for all selected WTs. This allows a fast visual comparison between the design values and the conditions on site.
Conversion to the new curtailment type "combined curtailment"
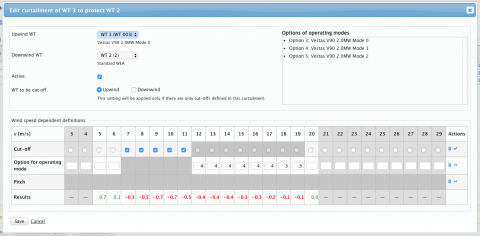
A new curtailment type has been added: "Change of operating mode". By changing the operation mode of a WT it is now possible to reduce its influence on an adjacent WT. You may combine the change of the operation mode with cut offs depending on the wind speed.
In addition to that it is now possible to define cut offs either for the upwind WT or for the downwind WT to protect the downwind WT.
Defining the Design Values of a WT plus Individual Design Values
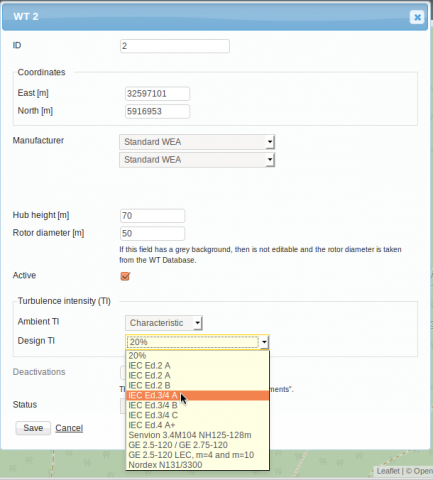
Some changes have been applied to the definition of the design turbulence intensity in the WT-editor. At first a choice between characteristic and representative ambient turbulence intensities has to be made. In a second selection menu you may choose from the established turbulence categories of the standards plus some newly added individual design values.
These changes also affect the input file (see chapter 6.1.1 of the documentation). A downward compatibility still exists.
Summary fo Curtailments in the Result File
The result file now contains a list of all considered curtailments. The list includes upwind WT, downwind WT, curtailed WT and view angle. This will help you to quickly identify the relevant wind directions which are affected by the curtailments.


